


MSc Data Science & Environmental Intelligence · BSc Petroleum Engineering
Python · Machine Learning · Time-Series Forecasting · GIS · Energy Analytics
I apply data science and energy-domain knowledge to electricity demand forecasting, geothermal resource assessment and energy-system analysis. My work combines machine learning, statistical modelling, geospatial analysis and reproducible Python workflows to investigate practical energy challenges.
I have completed an MSc in Data Science & Environmental Intelligence at the University of Plymouth, building on a Petroleum Engineering background. I am interested in graduate and junior roles in energy data analytics, data science, electricity systems and geospatial analytics.
Completed research project · GIS-based supply–demand assessment
How much of Plymouth's residential heating demand could potentially be met by closed-loop ground-source heat pump systems? This project integrates local geology, residential heat demand and candidate borehole locations to assess geothermal potential across the city.
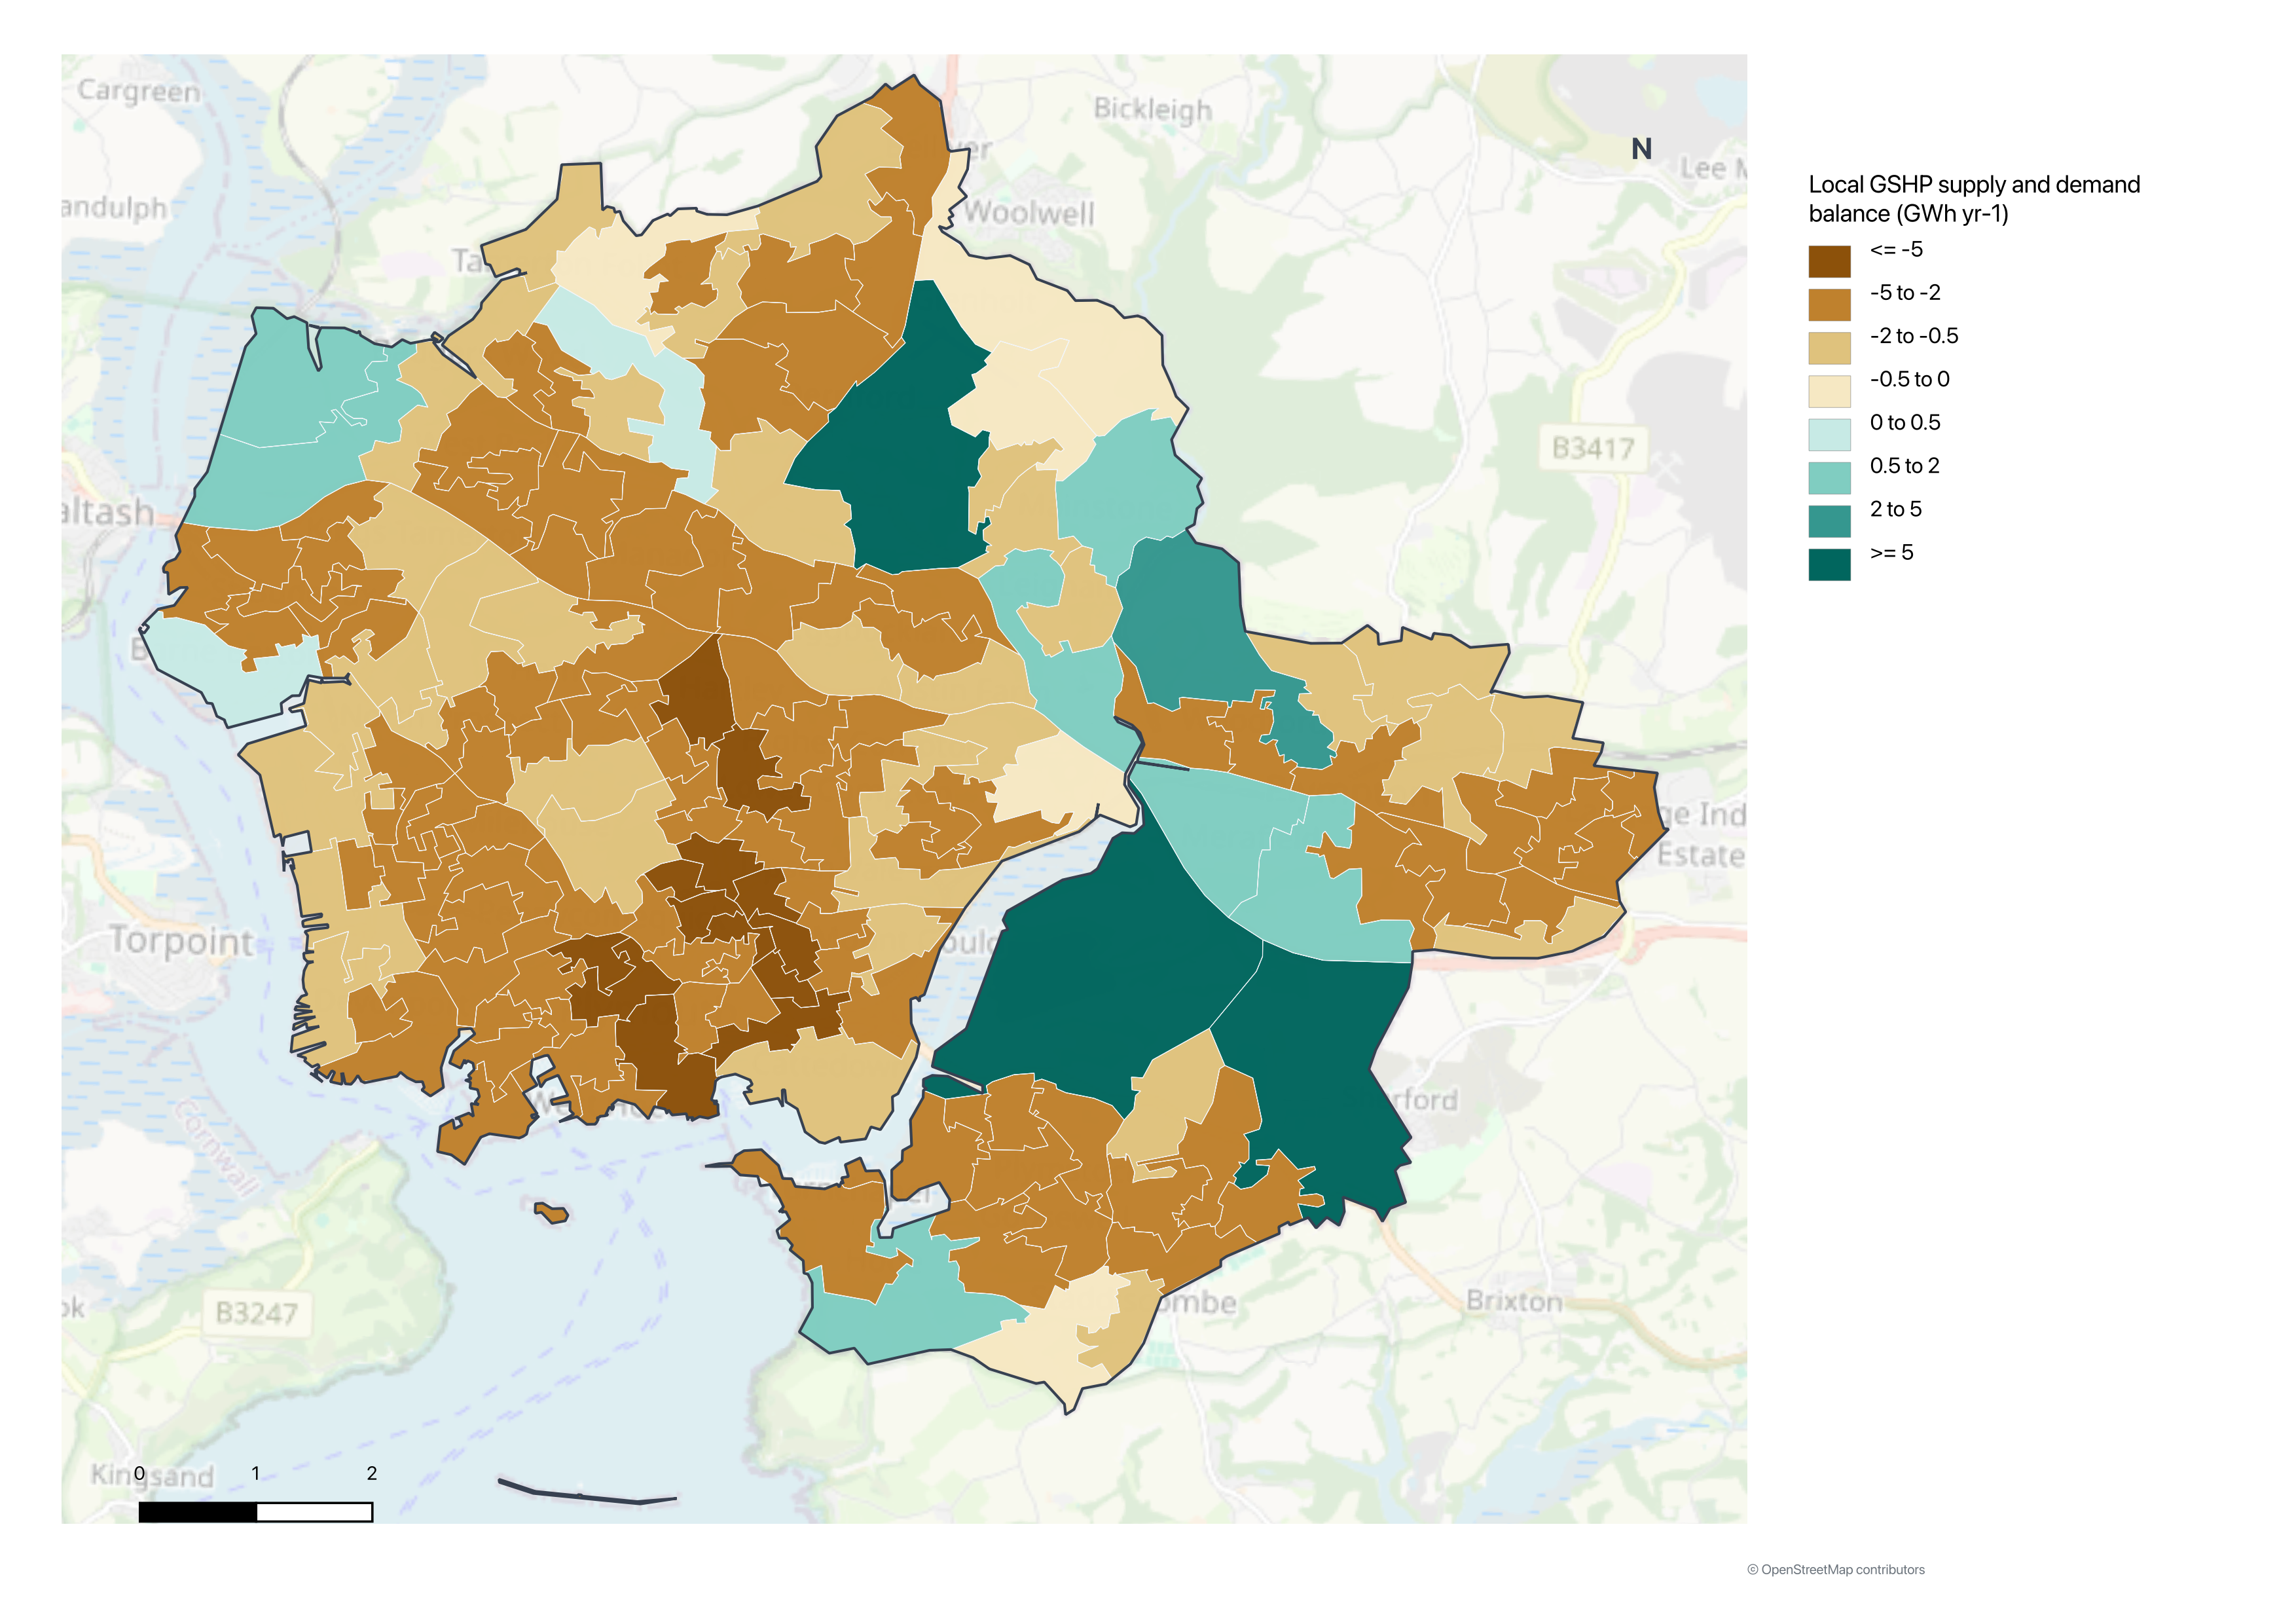
Spatial assessment of modelled geothermal supply relative to residential heating demand. The map's colour scale distinguishes local supply–demand conditions; see the project repository for the full methodology and interpretation.
Selected findings
- Assessed 164 Lower Layer Super Output Areas (LSOAs) using geological, demand and borehole-location data.
- Estimated 398.5 GWh/year of representative geothermal potential, with 356.0 GWh/year locally matched to residential demand.
- Estimated 44.8% modelled coverage of residential heating demand under the study assumptions.
- A 10,000-run Monte Carlo simulation yielded 44.3% median coverage and a central 90% interval of 42.5–45.9%.
- PRCC sensitivity analysis identified boiler efficiency and slate thermal conductivity as major drivers of uncertainty.
Why it matters: Comparing local geothermal potential with heating demand can help identify areas for more detailed site-specific geothermal assessment and inform early-stage heating decarbonisation planning. These are modelled estimates, not existing heat supply or a substitute for site investigations.
Methods: GeoPandas · QGIS · Spatial analysis · G.POT modelling · Monte Carlo simulation · PRCC sensitivity analysis
Explore the geothermal project
Published forecasting system · Daily cloud automation in progress
An end-to-end machine learning system that predicts Great Britain's national electricity demand for each half-hour of the following day. It combines historical demand, weather forecasts and embedded renewable generation forecasts, and evaluates predictions against a seasonal-naive baseline and NESO/Elexon's published day-ahead forecasts.
Out-of-sample results (mean absolute error; lower is better)
| Evaluation period | Seasonal naive | This model | NESO/Elexon |
|---|---|---|---|
| 2025 | 2,177 MW | 758 MW | 711 MW |
| 2026 (to early November) | 2,111 MW | 825 MW | 789 MW |
The model reduced error by approximately 60–65% against the seasonal-naive baseline. NESO/Elexon remained more accurate; its benchmark uses a later publication cutoff (09:00) than the model's 08:30 information cutoff, so this is not a strictly equal-cutoff comparison. Evaluation uses forecast rather than realised weather.
Engineering highlights
- Built a CatBoost–Ridge ensemble using demand lags, calendar features, renewable forecasts and bias-corrected weather forecasts.
- Implemented model tracking and champion-model management with MLflow, plus replay tests covering UK daylight-saving clock changes.
- Developed live prediction and scoring pipelines, with AWS S3 and GitHub Actions for cloud data refresh and forecast workflows.
Current stage: Model development, historical evaluation, live prediction code and cloud data refresh are implemented. Daily cloud forecasting and scheduling are being finalised; periodic retraining and a dashboard are planned.
Methods and tools: Python · pandas · CatBoost · Ridge Regression · MLflow · Time-Series Forecasting · AWS S3 · GitHub Actions
Explore the forecasting project and run instructions
- Python for Oil and Gas — decline curve analysis, production forecasting and a one-dimensional reservoir simulation exercise.
- ANN Enhanced Oil Recovery — neural network regression applied to enhanced oil recovery data.
| Area | Tools and methods |
|---|---|
| Data analysis | Python, pandas, NumPy, SciPy, exploratory analysis and visualisation |
| Machine learning & forecasting | scikit-learn, CatBoost, regression, time-series features, model evaluation |
| Geospatial analysis | GeoPandas, QGIS, Shapely, Rasterio, spatial joins and thematic mapping |
| Energy analytics | Electricity demand forecasting, geothermal assessment, energy demand modelling, uncertainty analysis |
| Reproducible workflows & cloud | Git, Jupyter, Conda, MLflow, GitHub Actions, AWS S3 |
Location: Plymouth, United Kingdom · Contact: Email · LinkedIn