Python renderer for the OpenDisplay Language (ODL).
odl-renderer is a standalone Python library for generating images from ODL drawing instructions. Originally extracted from the OpenEPaperLink Home Assistant integration, it provides a clean, async API for rendering text, shapes, icons, QR codes, and more to PIL images.
- Pure Rendering: No dependencies on Home Assistant or other frameworks
- 17 Element Types: Text, shapes, icons, QR codes, images, progress bars, and more
- Async/Await: Modern async API for efficient image generation
- Flexible Input: Accepts fonts as PIL objects, absolute paths, built-in names, or names resolved from caller-supplied directories
- Full Color Output: Returns PIL Image objects in full RGB/RGBA (caller handles dithering)
- Percentage-Based Coordinates: Position elements using percentages or absolute pixels
- Template-Ready: All values are plain data (templates expanded by caller)
uv add odl-renderer
# or
pip install odl-rendererimport asyncio
from odl_renderer import generate_image
async def main():
image = await generate_image(
width=296,
height=128,
elements=[
{
"type": "text",
"value": "Hello World",
"x": "50%",
"y": 50,
"font": "ppb",
"size": 24,
"color": "black",
"anchor": "mm",
},
{
"type": "rectangle",
"x_start": 10,
"y_start": 10,
"x_end": 100,
"y_end": 50,
"fill": "red",
"outline": "black",
"width": 2,
},
],
background="white",
accent_color="red",
)
image.save("output.png")
asyncio.run(main())| Category | Types |
|---|---|
| Text | text, multiline |
| Shapes | rectangle, rectangle_pattern, circle, ellipse, polygon, arc, line |
| Icons | icon, icon_sequence |
| Media | dlimg, qrcode |
| Visualizations | progress_bar, plot, diagram |
| Debug | debug_grid |
Elements that render text accept a font field. The following sources are tried in order:
- PIL object — an
ImageFont.FreeTypeFontpassed directly (returned as-is) - Absolute path — e.g.
"/config/www/fonts/MyFont.ttf"(loaded from disk) font_dirssearch — a relative name like"MyFont"or"MyFont.ttf"resolved against the directories passed viafont_dirsingenerate_image(), in order- Bundled assets — built-in names
"ppb"(PPB) and"rbm"(RBM) shipped with the library
Using custom font directories:
image = await generate_image(
    width=400,
    height=100,
    elements=[{"type": "text", "value": "Hi", "font": "MyFont", "size": 32}],
    font_dirs=["/config/www/fonts", "/media/fonts"],
)
generate_image silently skips directories that don't exist, so it's safe to pass a fixed list of candidate paths regardless of installation type.
A dlimg element can fetch any HTTP/HTTPS URL and open any file, and any text element can open a font by absolute path. When elements come from someone other than the application itself, pass allow_source to decide what may be loaded:
from odl_renderer import SourceNotAllowedError, generate_image

def allow_source(kind: str, source: str) -> bool:
    if kind == "url":
        return source.startswith("https://images.example.com/")
    return source.startswith("/srv/display-assets/")  # kind == "file"

try:
    image = await generate_image(width=400, height=300, elements=elements, allow_source=allow_source)
except SourceNotAllowedError as err:
print(f"refused {err.kind}: {err.source}")kindis"url"for an HTTP/HTTPS URL and"file"for an image or font given by absolute path.- The check happens where the source is loaded, so it covers every element type and skips hidden elements.
- URL checks run on the event loop. File checks run in the drawing thread, so they may do blocking work such as resolving symlinks.
- Embedded sources (bytes, PIL objects, data URIs), bundled fonts and fonts found by name in
font_dirsare not passed to the guard. SourceNotAllowedErroris aValueErrorand is raised as-is, without the usualElement N:prefix.
Independently of allow_source, a font name can never leave the font directories ("../x.ttf" is refused), and an HTTP image fetch is limited to 30 seconds and 32 MB.
| Value | Description |
|---|---|
"black" / "b" |
Black |
"white" / "w" |
White |
"red" / "r" |
Red |
"yellow" / "y" |
Yellow |
"blue" / "bl" |
Blue |
"green" / "gr" / "g" |
Green |
"gray" / "grey" |
Mid-gray |
"half_black" / "hb" |
Half-tone black |
"half_red" / "hr" |
Half-tone red |
"half_yellow" / "hy" |
Half-tone yellow |
"accent" / "a" |
Accent color (configured via accent_color param) |
"half_accent" / "ha" |
Half-tone accent |
"#RGB" / "#RRGGBB" |
Hex color |
Coordinates accept either absolute integers (10, 256) or percentage strings ("50%", "100%").
When y is omitted, elements stack automatically: each element is placed below the previous one using pos_y + y_padding (default padding: 10px).
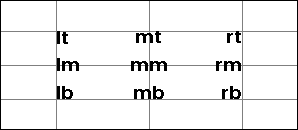
Used by text, icon, and icon_sequence to set which point of the element aligns to the given x/y coordinates, and by pivot (see rotation/mirror) to set the transform origin.
All of them use the PIL anchor format — horizontal axis first, then vertical:
| Code | Meaning |
|---|---|
lt |
Left-top |
mt |
Middle-top |
rt |
Right-top |
lm |
Left-middle |
mm |
Middle (center) |
rm |
Right-middle |
lb |
Left-bottom |
mb |
Middle-bottom |
rb |
Right-bottom |
icon and icon_sequence default to la (left-ascender) rather than lt; otherwise the codes are identical.
Each label below is drawn with its own anchor code at a crosshair; the intersection of the two gray lines is the x/y coordinate the text is anchored to:
[
    # Illustration only — crosshairs marking the nine x/y coordinates:
    {"type": "line", "x_start": 0, "x_end": 296, "y_start": 30, "fill": "gray"},
    {"type": "line", "x_start": 0, "x_end": 296, "y_start": 64, "fill": "gray"},
    {"type": "line", "x_start": 0, "x_end": 296, "y_start": 98, "fill": "gray"},
    {"type": "line", "x_start": 55, "x_end": 55, "y_start": 0, "y_end": 128, "fill": "gray"},
    {"type": "line", "x_start": 148, "x_end": 148, "y_start": 0, "y_end": 128, "fill": "gray"},
    {"type": "line", "x_start": 241, "x_end": 241, "y_start": 0, "y_end": 128, "fill": "gray"},

    {"type": "text", "value": "lt", "x": 55, "y": 30, "size": 18, "anchor": "lt"},
    {"type": "text", "value": "mt", "x": 148, "y": 30, "size": 18, "anchor": "mt"},
    {"type": "text", "value": "rt", "x": 241, "y": 30, "size": 18, "anchor": "rt"},
    {"type": "text", "value": "lm", "x": 55, "y": 64, "size": 18, "anchor": "lm"},
    {"type": "text", "value": "mm", "x": 148, "y": 64, "size": 18, "anchor": "mm"},
    {"type": "text", "value": "rm", "x": 241, "y": 64, "size": 18, "anchor": "rm"},
    {"type": "text", "value": "lb", "x": 55, "y": 98, "size": 18, "anchor": "lb"},
    {"type": "text", "value": "mb", "x": 148, "y": 98, "size": 18, "anchor": "mb"},
    {"type": "text", "value": "rb", "x": 241, "y": 98, "size": 18, "anchor": "rb"}
]
Every element type accepts an optional visible field. When falsy, the element is skipped entirely (no rendering, no position update). Defaults to true.
{
    "type": "text",
    "value": "Hidden",
    "x": 10,
    "y": 10,
    "visible": False
}
String values are coerced, which matters when visible is produced by a Home Assistant template (templates render to strings). The string "false" (case-insensitive) and empty/whitespace-only strings hide the element; any other non-empty string shows it. So a template that renders "false" hides the element as expected — rendering down to an empty string is no longer required.
Every element type accepts an optional rotation (degrees, positive = clockwise, arbitrary values allowed) and an optional pivot controlling the point it rotates about. The element is rendered, then rotated in place and composited back, so any element type works.
| Field | Required | Default | Notes |
|---|---|---|---|
rotation |
no | 0 |
Degrees, positive = clockwise |
pivot |
no | "mm" (center) |
Anchor keyword relative to the element (e.g. lt, mm, rb), or [x, y] canvas coords (percentages allowed, e.g. ["50%", "50%"]) |
Not to be confused with the
image/dlimg-onlyrotatefield, which rotates the source image before fitting it to the box. Userotationto tilt any rendered element on the canvas.
[
    {
        "type": "text",
        "value": "Rotated",
        "x": 148,
        "y": 64,
        "size": 30,
        "anchor": "mm",
        "rotation": 45
    },
    # Illustration only — the gray "ghost" of the original orientation:
    {
        "type": "text",
        "value": "Rotated",
        "x": 148,
        "y": 64,
        "size": 30,
        "anchor": "mm",
        "color": "gray"
    },
    # Illustration only — a dot marking the pivot (the element's center):
    {
        "type": "circle",
        "x": 148,
        "y": 64,
        "radius": 3,
        "fill": "red"
    }
]
Only the first element matters for usage — the gray "ghost" shows the un-rotated original and the red dot marks the pivot (pivot defaults to the element's center; set e.g. "pivot": "lt" or "pivot": [148, 64] to move it).

Every element type accepts an optional mirror to flip it about its pivot: "h" (horizontal), "v" (vertical), or "hv" (both). Unknown values are ignored.
| Field | Required | Default | Notes |
|---|---|---|---|
mirror |
no | — | "h", "v", or "hv" (case-insensitive) |
pivot |
no | "mm" (center) |
Same as rotation: anchor keyword or [x, y] |
[
    {
        "type": "polygon",
        "points": [[60, 30], [110, 30], [110, 45], [80, 45], [80, 98], [60, 98]],
        "fill": "red",
        "mirror": "h"
    },
    # Illustration only — the original outline and the flip axis:
    {
        "type": "polygon",
        "points": [[60, 30], [110, 30], [110, 45], [80, 45], [80, 98], [60, 98]],
        "outline": "gray",
        "width": 1
    },
    {
        "type": "line",
        "x_start": 85,
        "y_start": 20,
        "x_end": 85,
        "y_end": 108,
        "fill": "red",
        "width": 1
    }
]
The filled red shape is mirrored; the gray outline shows the original and the vertical red line marks the flip axis (the element's center by default).

Single-line text with optional wrapping, truncation, stroke, and inline color markup.
| Field | Required | Default | Notes |
|---|---|---|---|
value |
yes | — | Text content |
x |
yes | — | X position |
y |
no | auto | Y position; auto-stacks if omitted |
font |
no | "ppb" |
Built-in name ("ppb", "rbm"), file path, or PIL Font object |
size |
no | 20 |
Font size in pixels |
color |
no | "black" |
Text color |
anchor |
no | "lt" / "la" |
Anchor point; defaults to "la" when text wraps to multiple lines |
max_width |
no | — | Wrap text at this pixel width |
truncate |
no | false |
Truncate with … instead of wrapping |
align |
no | "left" |
"left", "center", or "right" |
spacing |
no | 5 |
Line spacing when wrapped |
stroke_width |
no | 0 |
Outline width |
stroke_fill |
no | "white" |
Outline color |
parse_colors |
no | false |
Enable [red]text[/red] inline color markup |
y_padding |
no | 10 |
Extra space above when auto-stacking |
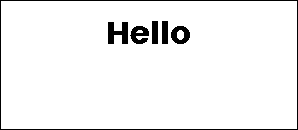
{
    "type": "text",
    "value": "Hello",
    "x": "50%",
    "y": 20,
    "size": 32,
    "anchor": "mt",
}
Inline color markup (requires parse_colors: true): wrap text in [color]...[/color] tags. Accepts all named colors, short names, and hex ([#ff0000]red text[/#ff0000]).
Fixed-line text split by a delimiter, each line placed at a fixed vertical offset.
| Field | Required | Default | Notes |
|---|---|---|---|
value |
yes | — | Full text content |
x |
yes | — | X position |
delimiter |
yes | — | Character used to split lines (e.g. "|") |
offset_y |
yes | — | Pixels between each line |
y |
no | auto | Y of first line |
font |
no | "ppb" |
Font |
size |
no | 20 |
Font size |
color |
no | "black" |
Text color |
anchor |
no | "lm" |
Anchor point |
align |
no | "left" |
Text alignment |
stroke_width |
no | 0 |
Outline width |
stroke_fill |
no | "white" |
Outline color |
parse_colors |
no | false |
Inline color markup |
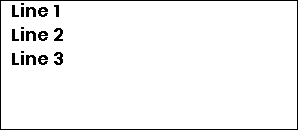
{
    "type": "multiline",
    "value": "Line 1|Line 2|Line 3",
    "x": 10,
    "y": 10,
    "delimiter": "|",
    "offset_y": 24,
    "size": 18,
}
Rectangle with optional fill, outline, and rounded corners.
| Field | Required | Default | Notes |
|---|---|---|---|
x_start |
yes | — | Left edge |
y_start |
yes | — | Top edge |
x_end |
yes | — | Right edge |
y_end |
yes | — | Bottom edge |
fill |
no | — | Fill color |
outline |
no | "black" |
Border color |
width |
no | 1 |
Border width |
corners |
no | — | Which corners to round: "all", "top_left", "top_right", "bottom_left", "bottom_right" (comma-separated) |
radius |
no | 10 |
Corner radius; only applies when corners is set |
pattern |
no | — | Pattern drawn over the fill and under the outline: a name ("hatch") or an object, see Pattern |
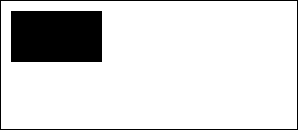
{
    "type": "rectangle",
    "x_start": 10,
    "y_start": 10,
    "x_end": 100,
    "y_end": 60,
    "fill": "black",
}
Every closed shape (rectangle, circle, ellipse, polygon, arc) and the filled parts of
progress_bar, diagram bars and plot series can carry a pattern: hatching, stripes, dots,
a grid or a tone. It is drawn
over the fill (so the fill shows between the lines), inside the shape (rounded corners
included) and under the outline. Pattern pixels are exact palette colors, never blended or
anti-aliased, so every dither mode leaves them unchanged. The pattern is anchored to the
canvas, not to the shape, so shapes that touch continue the same pattern without a seam.
A renderer that does not know the field ignores it and draws the plain fill. Give a name for the
defaults ("pattern": "hatch") or an object:
| Field | Applies to | Default | Notes |
|---|---|---|---|
type |
all | — | "hatch", "dots", "grid" or "tone"; "solid", "none" or an unknown type draws no pattern |
color |
all | "black" |
Any color; alpha blends with what is below |
spacing |
hatch, dots, grid | 4 |
Pixels between lines or dots (for slanted hatching measured across the lines) |
width |
hatch, dots, grid | 1 |
Thickness of a line or size of a dot in pixels |
angle |
hatch | 45 |
Degrees counter-clockwise from the x axis: 0 horizontal, 90 vertical, 45 rises to the right, 135 falls |
level |
tone | 50 |
Share of ink, 0 to 100; an ordered (Bayer 8 x 8) dither, so 64 steps, each darker tone adding to the lighter |
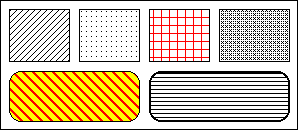
[
    {"type": "rectangle", "x_start": 8, "y_start": 8, "x_end": 68, "y_end": 60, "pattern": "hatch"},
    {"type": "rectangle", "x_start": 78, "y_start": 8, "x_end": 138, "y_end": 60, "pattern": {"type": "dots", "spacing": 5}},
    {"type": "rectangle", "x_start": 148, "y_start": 8, "x_end": 208, "y_end": 60, "pattern": {"type": "grid", "spacing": 8, "color": "red"}},
    {"type": "rectangle", "x_start": 218, "y_start": 8, "x_end": 288, "y_end": 60, "pattern": {"type": "tone", "level": 30}},
    {"type": "rectangle", "x_start": 8, "y_start": 70, "x_end": 138, "y_end": 120, "fill": "yellow", "radius": 12, "pattern": {"type": "hatch", "angle": 135, "color": "red", "width": 2, "spacing": 7}},
    {"type": "rectangle", "x_start": 148, "y_start": 70, "x_end": 288, "y_end": 120, "radius": 12, "width": 2, "pattern": {"type": "hatch", "angle": 0}},
]
A tone is a fixed gray made of black and white pixels, the same on every shape, so it looks the
same in a preview and on the display. It does not depend on dither, unlike the half_* colors:
[
    {"type": "rectangle", "x_start": 8, "y_start": 8, "x_end": 24, "y_end": 120, "pattern": {"type": "tone", "level": 100}},
    {"type": "rectangle", "x_start": 30, "y_start": 8, "x_end": 46, "y_end": 120, "pattern": {"type": "tone", "level": 90}},
    {"type": "rectangle", "x_start": 52, "y_start": 8, "x_end": 68, "y_end": 120, "pattern": {"type": "tone", "level": 80}},
    {"type": "rectangle", "x_start": 74, "y_start": 8, "x_end": 90, "y_end": 120, "pattern": {"type": "tone", "level": 70}},
    {"type": "rectangle", "x_start": 96, "y_start": 8, "x_end": 112, "y_end": 120, "pattern": {"type": "tone", "level": 60}},
    {"type": "rectangle", "x_start": 118, "y_start": 8, "x_end": 134, "y_end": 120, "pattern": {"type": "tone", "level": 50}},
    {"type": "rectangle", "x_start": 140, "y_start": 8, "x_end": 156, "y_end": 120, "pattern": {"type": "tone", "level": 40}},
    {"type": "rectangle", "x_start": 162, "y_start": 8, "x_end": 178, "y_end": 120, "pattern": {"type": "tone", "level": 30}},
    {"type": "rectangle", "x_start": 184, "y_start": 8, "x_end": 200, "y_end": 120, "pattern": {"type": "tone", "level": 20}},
    {"type": "rectangle", "x_start": 206, "y_start": 8, "x_end": 222, "y_end": 120, "pattern": {"type": "tone", "level": 10}},
    {"type": "rectangle", "x_start": 238, "y_start": 8, "x_end": 288, "y_end": 120, "fill": "half_black", "outline": None},
]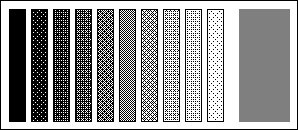
On the right, half_black for comparison: one fixed tone whose pixels depend on the dithering of
the display.
All pattern types, with angles and parameters, and how a pattern layers with a fill, an outline, rounded corners and a color with alpha:
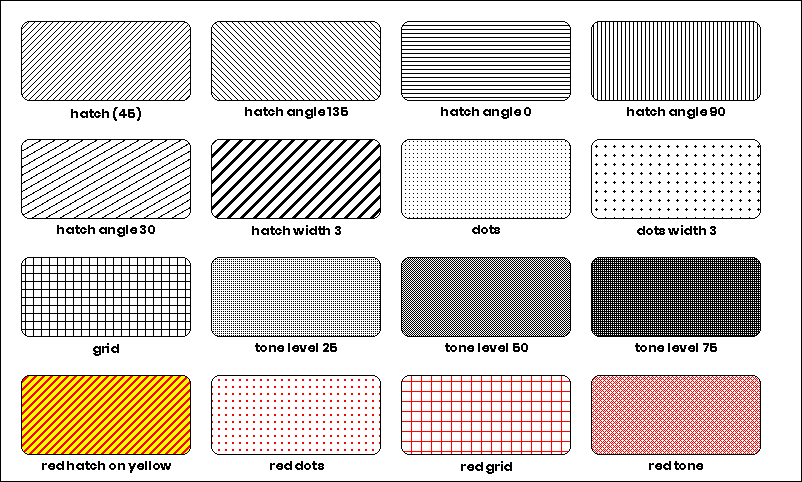
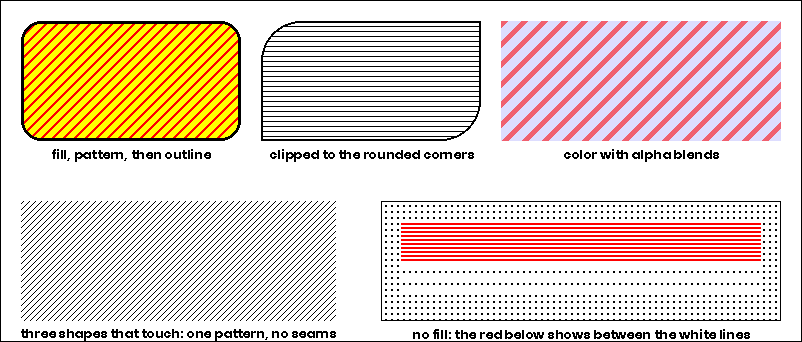
The same pattern field works on every shape that has an inside, always with the same rules:
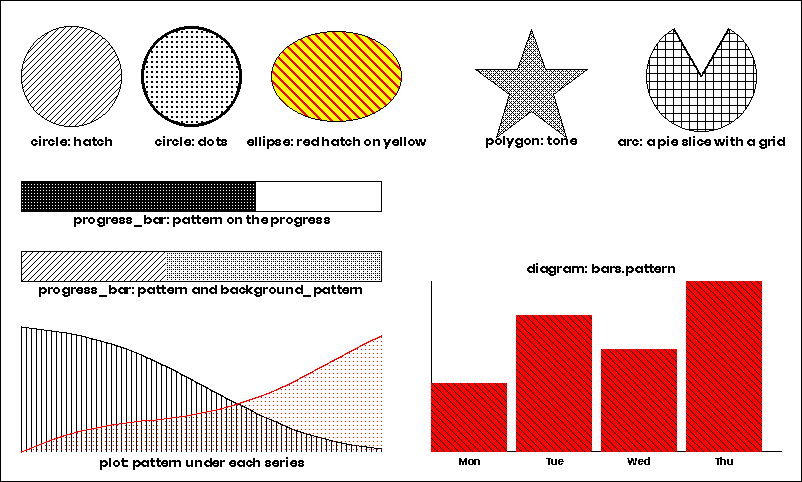
fill first, then the pattern clipped to the silhouette, then the outline.
| Element | Where the pattern goes |
|---|---|
rectangle, circle, ellipse, polygon |
the whole shape |
arc |
the pie slice (a pattern turns the arc into a pie slice, like fill does) |
progress_bar |
pattern on the progress part, background_pattern on the empty track |
diagram |
bars.pattern on every bar |
plot |
pattern in a series: the area between the line and the bottom of the diagram, in the series color unless the pattern sets its own |
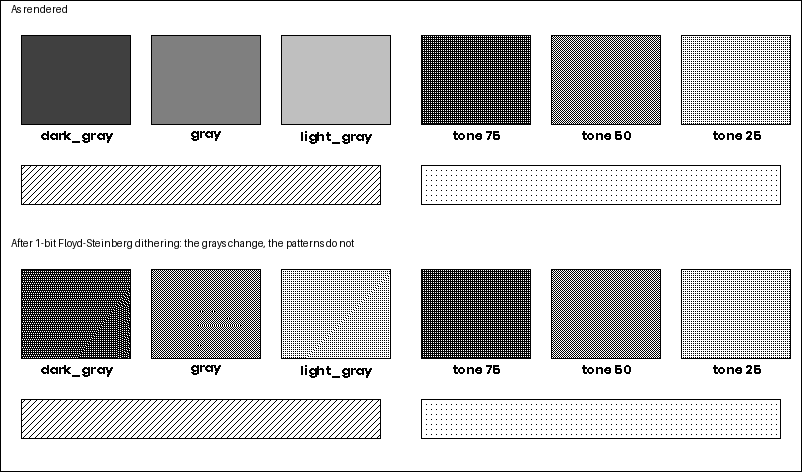
A pattern is made of palette pixels, so a display that dithers its picture leaves it unchanged, where a gray fill turns into noise:
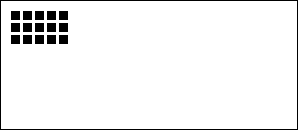
Repeating grid of rectangles — useful for dot matrices, grids, and decorative patterns.
| Field | Required | Default | Notes |
|---|---|---|---|
x_start |
yes | — | Starting X |
y_start |
yes | — | Starting Y |
x_size |
yes | — | Width of each rectangle |
y_size |
yes | — | Height of each rectangle |
x_repeat |
yes | — | Number of columns |
y_repeat |
yes | — | Number of rows |
x_offset |
yes | — | Horizontal gap between rectangles |
y_offset |
yes | — | Vertical gap between rectangles |
fill |
no | — | Fill color |
outline |
no | "black" |
Border color |
width |
no | 1 |
Border width |
corners / radius |
no | — | Same as rectangle |
{
    "type": "rectangle_pattern",
    "x_start": 10,
    "y_start": 10,
    "x_size": 8,
    "y_size": 8,
    "x_repeat": 5,
    "y_repeat": 3,
    "x_offset": 4,
    "y_offset": 4,
    "fill": "black",
}
Circle defined by center point and radius.
| Field | Required | Default | Notes |
|---|---|---|---|
x |
yes | — | Center X |
y |
yes | — | Center Y |
radius |
yes | — | Radius in pixels |
fill |
no | — | Fill color |
outline |
no | "black" |
Border color |
width |
no | 1 |
Border width |
pattern |
no | — | Pattern drawn over the fill and under the outline: a name ("hatch") or an object, see Pattern |
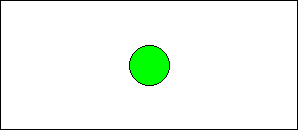
{
    "type": "circle",
    "x": "50%",
    "y": "50%",
    "radius": 20,
    "fill": "green",
    "outline": "black",
}
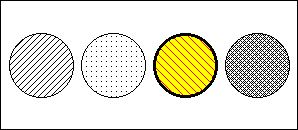
With a pattern:
[
    {"type": "circle", "x": 40, "y": 64, "radius": 32, "pattern": "hatch"},
    {"type": "circle", "x": 112, "y": 64, "radius": 32, "pattern": {"type": "dots", "spacing": 5}},
    {"type": "circle", "x": 184, "y": 64, "radius": 32, "fill": "yellow", "width": 3, "pattern": {"type": "hatch", "color": "red", "angle": 135, "spacing": 6}},
    {"type": "circle", "x": 256, "y": 64, "radius": 32, "pattern": {"type": "tone", "level": 40}},
]
Ellipse defined by a bounding box.
| Field | Required | Default | Notes |
|---|---|---|---|
x_start |
yes | — | Left edge |
y_start |
yes | — | Top edge |
x_end |
yes | — | Right edge |
y_end |
yes | — | Bottom edge |
fill |
no | — | Fill color |
outline |
no | "black" |
Border color |
width |
no | 1 |
Border width |
pattern |
no | — | Pattern drawn over the fill and under the outline: a name ("hatch") or an object, see Pattern |
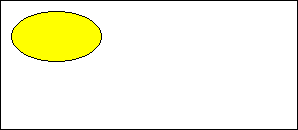
{
    "type": "ellipse",
    "x_start": 10,
    "y_start": 10,
    "x_end": 100,
    "y_end": 60,
    "fill": "yellow",
}
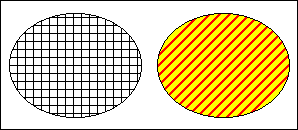
With a pattern:
[
    {"type": "ellipse", "x_start": 8, "y_start": 12, "x_end": 140, "y_end": 116, "pattern": {"type": "grid", "spacing": 8}},
    {"type": "ellipse", "x_start": 156, "y_start": 12, "x_end": 288, "y_end": 116, "fill": "yellow", "pattern": {"type": "hatch", "angle": 45, "color": "red", "width": 2, "spacing": 7}},
]
Arbitrary polygon defined by a list of vertices.
| Field | Required | Default | Notes |
|---|---|---|---|
points |
yes | — | List of [x, y] pairs |
fill |
no | — | Fill color |
outline |
no | "black" |
Border color |
pattern |
no | — | Pattern drawn over the fill and under the outline: a name ("hatch") or an object, see Pattern |
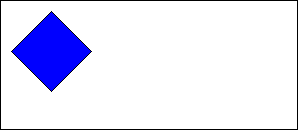
{
    "type": "polygon",
    "points": [[10, 50], [50, 10], [90, 50], [50, 90]],
    "fill": "blue",
}
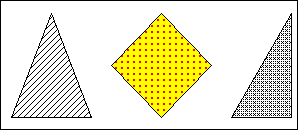
With a pattern:
[
    {"type": "polygon", "points": [[10, 116], [90, 116], [50, 12]], "pattern": "hatch"},
    {"type": "polygon", "points": [[110, 64], [160, 12], [210, 64], [160, 116]], "fill": "yellow", "pattern": {"type": "dots", "color": "red", "width": 2, "spacing": 6}},
    {"type": "polygon", "points": [[230, 116], [290, 116], [290, 12]], "pattern": {"type": "tone", "level": 30}},
]
Arc or pie slice defined by center, radius, and angle range.
| Field | Required | Default | Notes |
|---|---|---|---|
x |
yes | — | Center X |
y |
yes | — | Center Y |
radius |
yes | — | Radius in pixels |
start_angle |
yes | — | Start angle in degrees (0 = right, counter-clockwise) |
end_angle |
yes | — | End angle in degrees |
fill |
no | — | Fill color (creates a pie slice) |
pattern |
no | — | Pattern for the pie slice, see Pattern; also makes it a pie slice |
outline |
no | "black" |
Border color |
width |
no | 1 |
Border width |
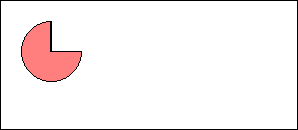
{
    "type": "arc",
    "x": 50,
    "y": 50,
    "radius": 30,
    "start_angle": 0,
    "end_angle": 270,
    "outline": "black",
    "fill": "half_red",
}
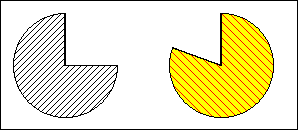
With a pattern:
[
    {"type": "arc", "x": 64, "y": 64, "radius": 52, "start_angle": 0, "end_angle": 270, "pattern": "hatch"},
    {"type": "arc", "x": 220, "y": 64, "radius": 52, "start_angle": -90, "end_angle": 200, "fill": "yellow", "pattern": {"type": "hatch", "angle": 135, "color": "red", "spacing": 6}},
]
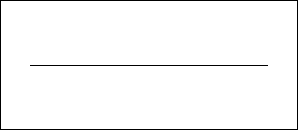
Straight line between two points with optional dashing.
| Field | Required | Default | Notes |
|---|---|---|---|
x_start |
yes | — | Start X |
x_end |
yes | — | End X |
y_start |
no | auto | Start Y |
y_end |
no | y_start |
End Y (horizontal line if omitted) |
fill |
no | "black" |
Line color |
width |
no | 1 |
Line width |
dashed |
no | false |
Enable dashed style |
dash_length |
no | 5 |
Length of each dash |
space_length |
no | 3 |
Gap between dashes |
{
    "type": "line",
    "x_start": "10%",
    "y_start": "50%",
    "x_end": "90%",
    "y_end": "50%",
    "fill": "black",
}
Icons use the bundled Material Design Icons font (7,000+ icons). Pass the icon name with or without the mdi: prefix.
Single MDI icon.
| Field | Required | Default | Notes |
|---|---|---|---|
value |
yes | — | Icon name, e.g. "home" or "mdi:home" |
x |
yes | — | X position |
y |
yes | — | Y position |
size |
yes | — | Icon size in pixels |
color |
no | "black" |
Icon color |
anchor |
no | "mm" |
Anchor point |
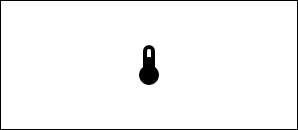
{
    "type": "icon",
    "value": "mdi:thermometer",
    "x": "50%",
    "y": "50%",
    "size": 48,
    "anchor": "mm",
}
Row or column of MDI icons.
| Field | Required | Default | Notes |
|---|---|---|---|
icons |
yes | — | List of icon names |
x |
yes | — | Starting X |
y |
yes | — | Starting Y |
size |
yes | — | Icon size in pixels |
direction |
no | "right" |
"right", "left", "up", or "down" |
spacing |
no | size / 4 |
Gap between icons |
color |
no | "black" |
Icon color |
anchor |
no | "mm" |
Anchor point |
{
    "type": "icon_sequence",
    "icons": ["mdi:weather-sunny", "mdi:weather-cloudy", "mdi:weather-rainy"],
    "x": 20,
    "y": 20,
    "size": 32,
}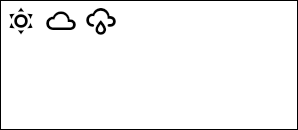
Image from a URL, file path, data URI, bytes, or PIL Image object. Resized to fit the specified dimensions.
Note: Entity IDs are not resolved — the caller must pass a URL, file path, or image object directly.
| Field | Required | Default | Notes |
|---|---|---|---|
url |
yes | — | Source: HTTP URL, file path, data URI, bytes, or PIL.Image |
x |
yes | — | X position |
y |
yes | — | Y position |
xsize |
yes | — | Target width |
ysize |
yes | — | Target height |
rotate |
no | 0 |
Rotation in degrees |
resize_method |
no | "stretch" |
"stretch", "crop", "cover", or "contain" |
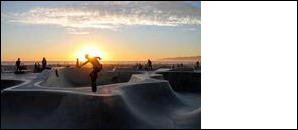
{
    "type": "dlimg",
    "url": "https://picsum.photos/seed/odl/200/150",
    "x": 0,
    "y": 0,
    "xsize": 200,
    "ysize": 150,
    "resize_method": "cover",
}
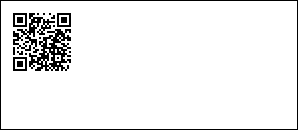
QR code generated from any text or URL.
| Field | Required | Default | Notes |
|---|---|---|---|
data |
yes | — | QR code content |
x |
yes | — | X position |
y |
yes | — | Y position |
color |
no | "black" |
Foreground color |
bgcolor |
no | "white" |
Background color |
border |
no | 1 |
Quiet zone size in modules |
boxsize |
no | 2 |
Pixel size of each module |
{
    "type": "qrcode",
    "data": "https://opendisplay.org",
    "x": 10,
    "y": 10,
}
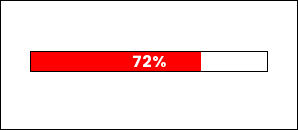
Horizontal or vertical progress bar with optional percentage label.
| Field | Required | Default | Notes |
|---|---|---|---|
x_start |
yes | — | Left edge |
y_start |
yes | — | Top edge |
x_end |
yes | — | Right edge |
y_end |
yes | — | Bottom edge |
progress |
yes | — | Fill level 0–100 (clamped automatically) |
direction |
no | "right" |
"right", "left", "up", or "down" |
fill |
no | "red" |
Progress fill color |
background |
no | "white" |
Empty track color |
outline |
no | "black" |
Border color |
width |
no | 1 |
Border width |
pattern |
no | — | Pattern on the progress part, see Pattern |
background_pattern |
no | — | Pattern on the empty track |
show_percentage |
no | false |
Overlay percentage text |
font_name |
no | "ppb" |
Font for percentage text |
{
    "type": "progress_bar",
    "x_start": "10%",
    "y_start": 50,
    "x_end": "90%",
    "y_end": 70,
    "progress": 72,
    "fill": "accent",
    "show_percentage": True,
}
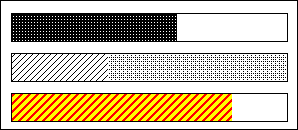
With a pattern:
[
    {"type": "progress_bar", "x_start": 10, "y_start": 12, "x_end": 286, "y_end": 40, "progress": 60, "fill": "black", "pattern": {"type": "dots", "color": "white", "spacing": 3}},
    {"type": "progress_bar", "x_start": 10, "y_start": 52, "x_end": 286, "y_end": 80, "progress": 35, "fill": "white", "pattern": "hatch", "background_pattern": {"type": "tone", "level": 20}},
    {"type": "progress_bar", "x_start": 10, "y_start": 92, "x_end": 286, "y_end": 120, "progress": 80, "fill": "yellow", "pattern": {"type": "hatch", "color": "red", "width": 2, "spacing": 6}},
]
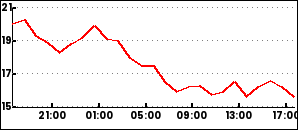
Time-series line chart with configurable axes, grid, and legends. Requires a DataProvider in the drawing context to supply historical data.
| Field | Required | Default | Notes |
|---|---|---|---|
data |
yes | — | List of series configs (see below) |
x_start |
no | 0 |
Chart left edge |
y_start |
no | 0 |
Chart top edge |
x_end |
no | image width | Chart right edge |
y_end |
no | image height | Chart bottom edge |
duration |
no | 86400 |
Time window in seconds |
low / high |
no | auto | Y-axis range override |
font |
no | "ppb" |
Font for labels |
Series, axis, and legend options
Each series in data:
| Field | Default | Notes |
|---|---|---|
entity |
required | Data source identifier passed to DataProvider |
color |
required | Line color |
width |
2 |
Line width |
smooth |
false |
Smooth the line |
line_style |
"solid" |
"solid", "dashed", or "dotted" |
pattern |
— | Pattern for the area under the line, in the series color unless it sets color; see Pattern |
show_points |
false |
Draw data points |
span_gaps |
false |
Connect across missing values |
yaxis (optional dict):
| Field | Default |
|---|---|
tick_every |
required |
color |
"black" |
grid |
true |
grid_style |
"dotted" |
xaxis (optional dict):
| Field | Default |
|---|---|
color |
"black" |
grid |
true |
grid_style |
"dotted" |
ylegend (optional dict):
| Field | Default |
|---|---|
position |
"left" |
size |
10 |
color |
"black" |
xlegend (optional dict):
| Field | Default |
|---|---|
interval |
required |
format |
"%H:%M" |
position |
"bottom" |
size |
10 |
snap_to_hours |
true |
{
  "type": "plot",
  "x_start": 0,
  "y_start": 6,
  "x_end": 292,
  "y_end": 120,
  "round_values": True,
  "data":
    [
      {
        "entity": "sensor.temperature",
        "color": "red",
        "width": 2
      }
    ],
  "yaxis":
    {
      "tick_every": 2,
      "grid_color": "gray"
    },
  "ylegend":
    {
      "position": "left"
    },
  "xaxis":
    {
      "color": "black",
      "grid": False
    },
  "xlegend":
    {
      "interval": 14400
    }
}
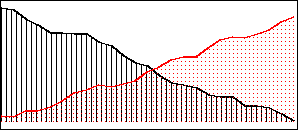
With a pattern under the line:
{
    "type": "plot",
    "x_start": 0,
    "y_start": 6,
    "x_end": 292,
    "y_end": 120,
    "round_values": True,
    "data": [
        {
            "entity": "sensor.temperature",
            "color": "black",
            "width": 2,
            "pattern": {"type": "hatch", "angle": 90, "spacing": 5},
        },
        {
            "entity": "sensor.humidity",
            "color": "red",
            "width": 2,
            "pattern": {"type": "dots", "spacing": 4},
        },
    ],
}
Series are drawn in order, so a later series paints over an earlier one. The plot draws no
background and no frame: axes, grid and legends appear only when yaxis, xaxis, ylegend
and xlegend are given, so the example above is just the lines and the areas under them.
Simple bar chart with labeled axes.
| Field | Required | Default | Notes |
|---|---|---|---|
x |
yes | — | X position |
height |
yes | — | Diagram height |
width |
no | image width | Diagram width |
margin |
no | 20 |
Margin from edges |
bars |
no | — | Bar chart config (see below) |
bars config:
| Field | Notes |
|---|---|
values |
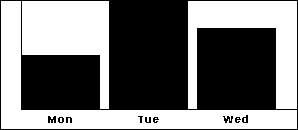
Semicolon-separated "label,value" pairs: "Mon,10;Tue,20;Wed,15" |
color |
Bar fill color |
font |
Font name |
legend_size |
Label font size |
legend_color |
Label color |
pattern |
Pattern on every bar, over color; see Pattern |
{
    "type": "diagram",
    "x": 0,
    "height": 128,
    "bars": {
        "values": "Mon,10;Tue,20;Wed,15",
        "color": "black",
    },
}
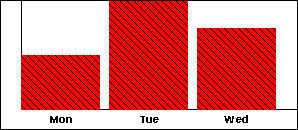
With a pattern on the bars:
{
    "type": "diagram",
    "x": 0,
    "height": 128,
    "bars": {
        "values": "Mon,10;Tue,20;Wed,15",
        "color": "red",
        "pattern": {"type": "hatch", "color": "black", "angle": 135, "spacing": 5},
    },
}
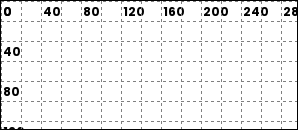
Renders a coordinate grid over the image. Useful during layout development.
| Field | Required | Default | Notes |
|---|---|---|---|
spacing |
no | 20 |
Grid cell size in pixels |
line_color |
no | "black" |
Grid line color |
dashed |
no | true |
Use dashed lines |
dash_length |
no | 2 |
Dash segment length |
space_length |
no | 4 |
Gap between dashes |
show_labels |
no | true |
Show coordinate labels |
label_step |
no | spacing * 2 |
Interval between labels |
label_color |
no | "black" |
Label color |
label_font_size |
no | 12 |
Label font size |
font |
no | "ppb" |
Font for labels |
{
    "type": "debug_grid",
    "spacing": 20,
    "line_color": "gray",
}