

An open-source, production-ready Blazor charts component library built on the Blazor and Chart.js JavaScript library.
Getting Started →


Get started any way you want
- Clone the repo:
git clone https://github.com/BlazorExpress/BlazorExpress.ChartJS - Install with the .NET CLI:
dotnet add package BlazorExpress.ChartJS --version 2.0.0 - Or with the NuGet Package Manager Console:
Install-Package BlazorExpress.ChartJS -Version 2.0.0 - Upgrading from 1.x? 2.0.0 changes some defaults and behaviour, so read the 2.0.0 release notes first.
| BlazorExpress.ChartJS | .NET | Chart.js | chartjs-plugin-datalabels |
|---|---|---|---|
| 2.0.0+ | 8, 9, 10, 11 | 4.6.1 | 2.2.0 |
| 1.2.2+ | 8, 9, 10 | 4.4.1 | 2.2.0 |
| 1.1.0+ | 8 | 4.4.1 | 2.2.0 |
| 1.0.0 | 8 | 4.0.1 | 2.2.0 |
| Component Name | Demos | Docs |
|---|---|---|
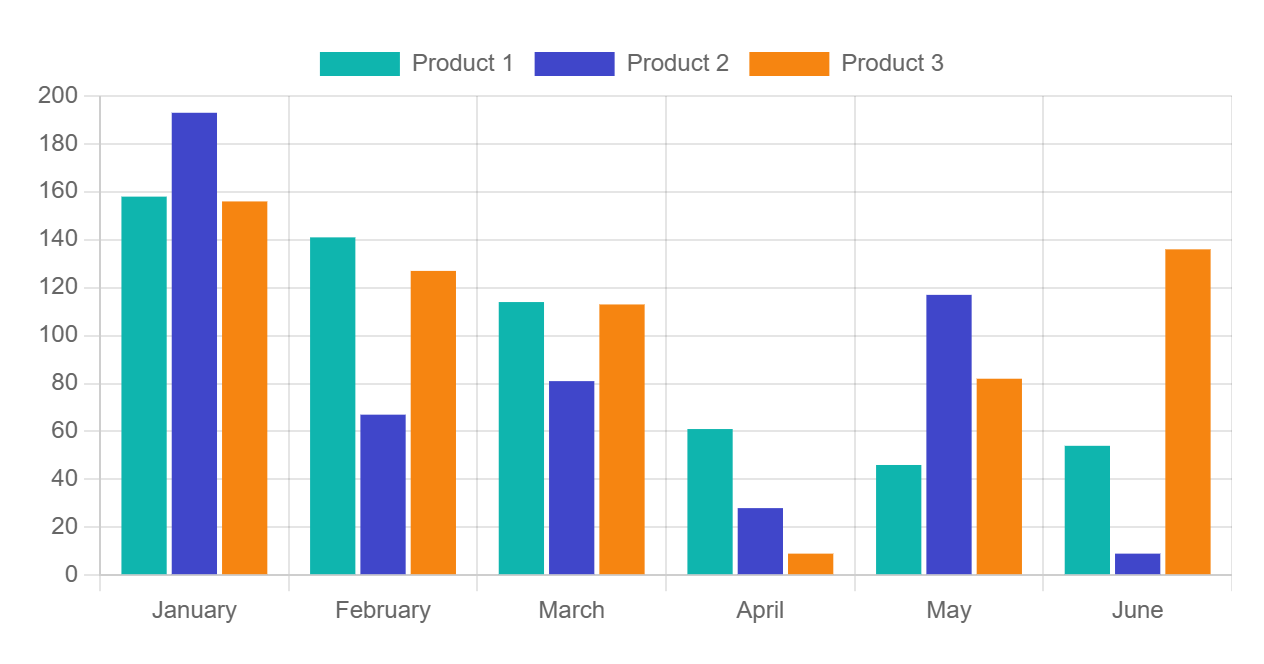
| Charts: Bar chart | Demos | Docs |
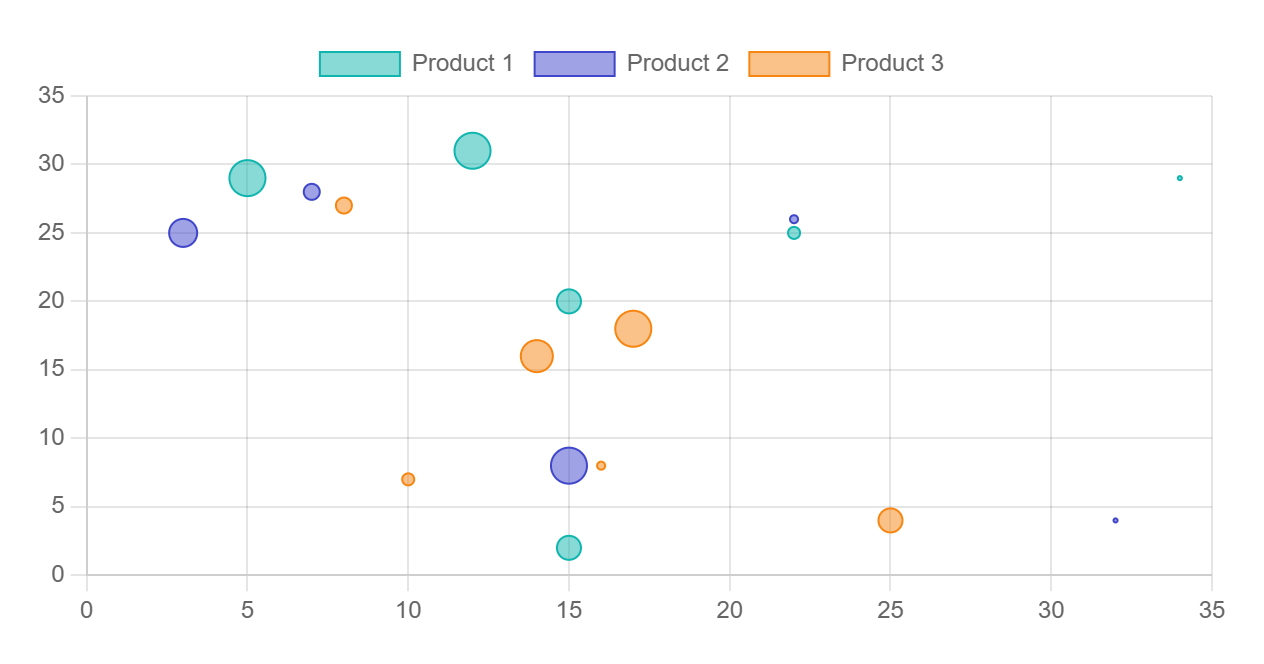
| Charts: Bubble chart | Demos | Docs |
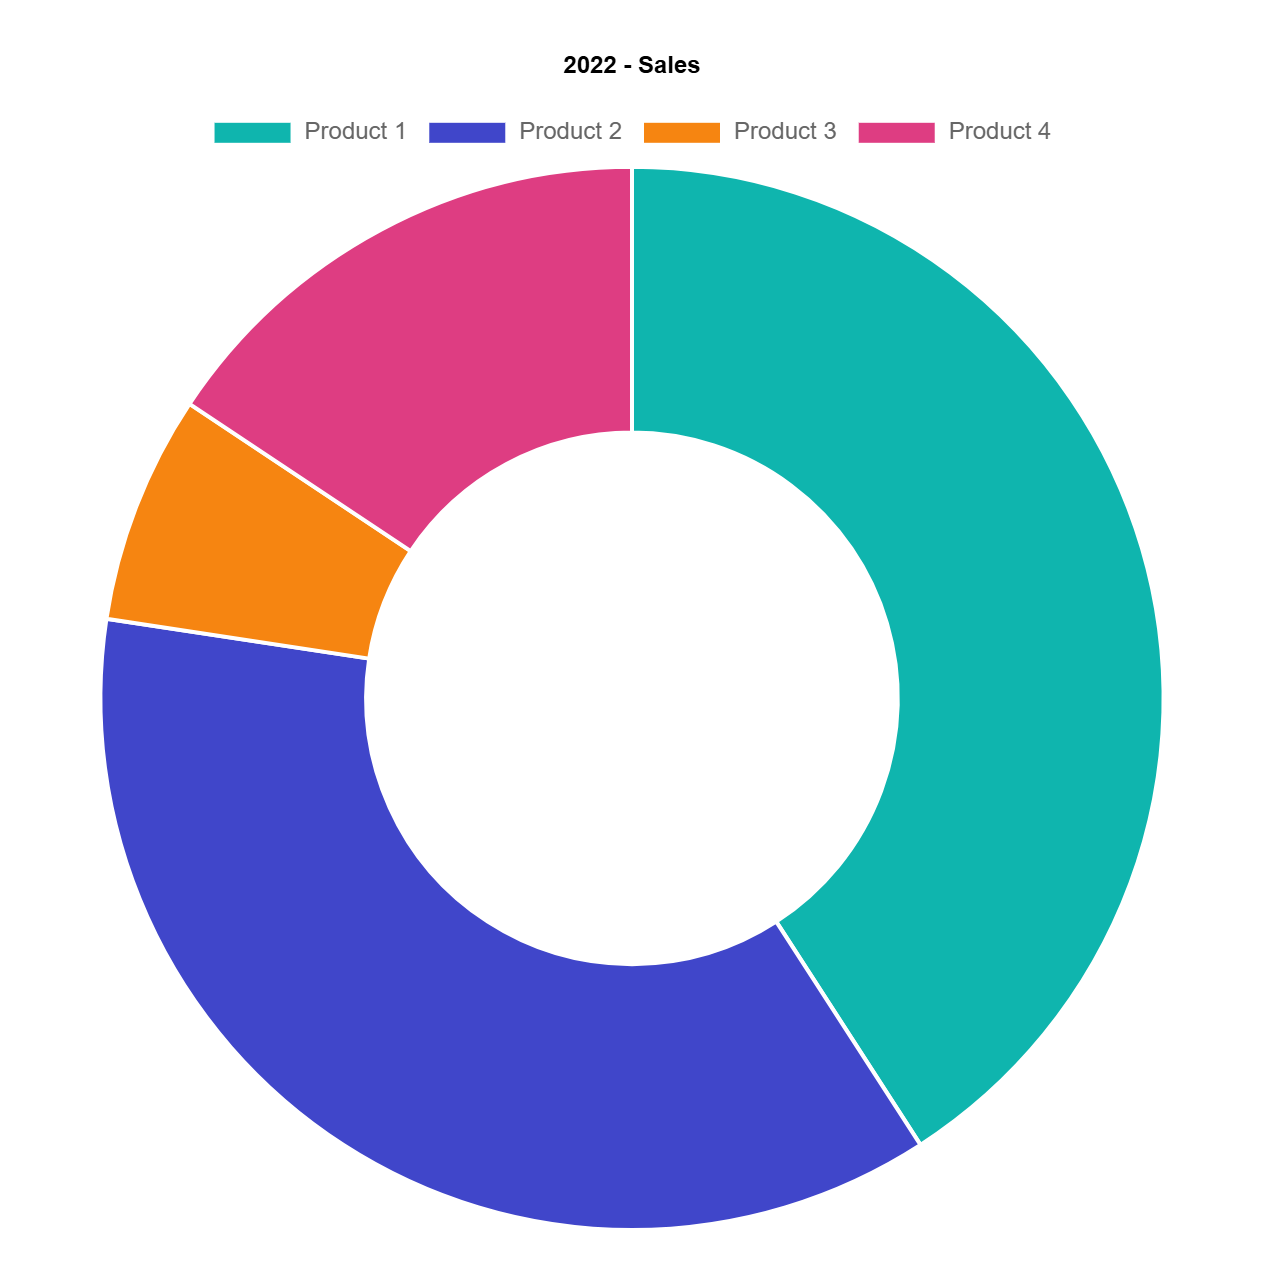
| Charts: Doughnut chart | Demos | Docs |
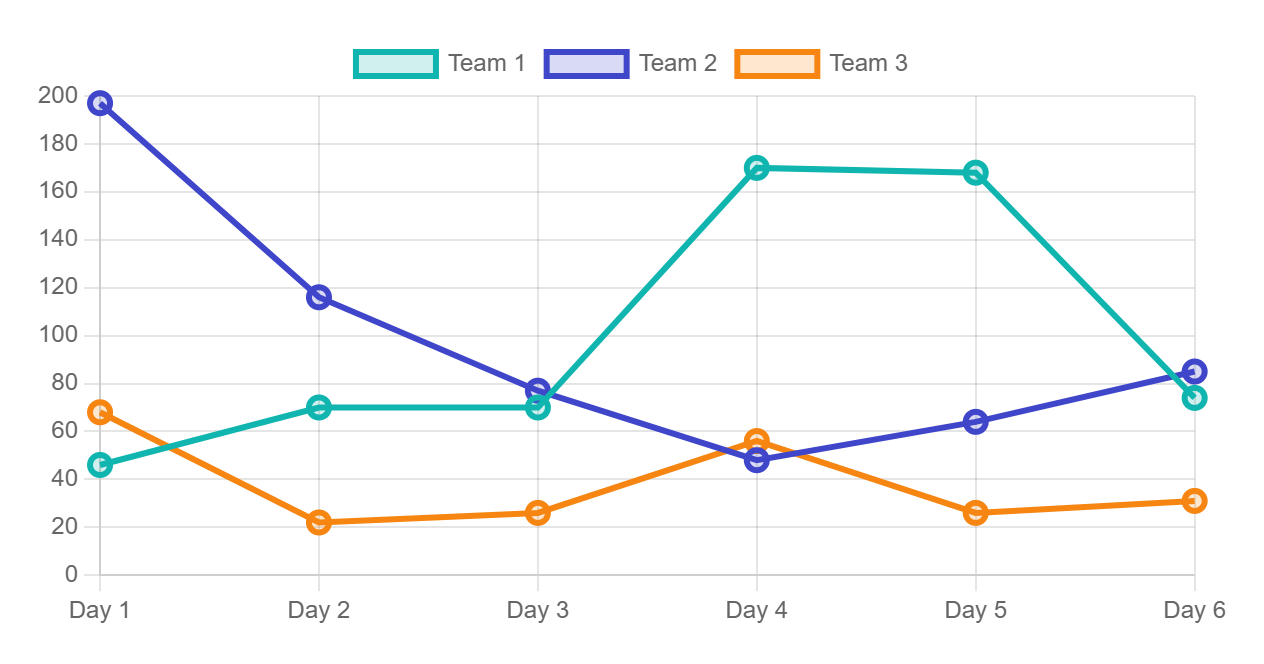
| Charts: Line chart | Demos | Docs |
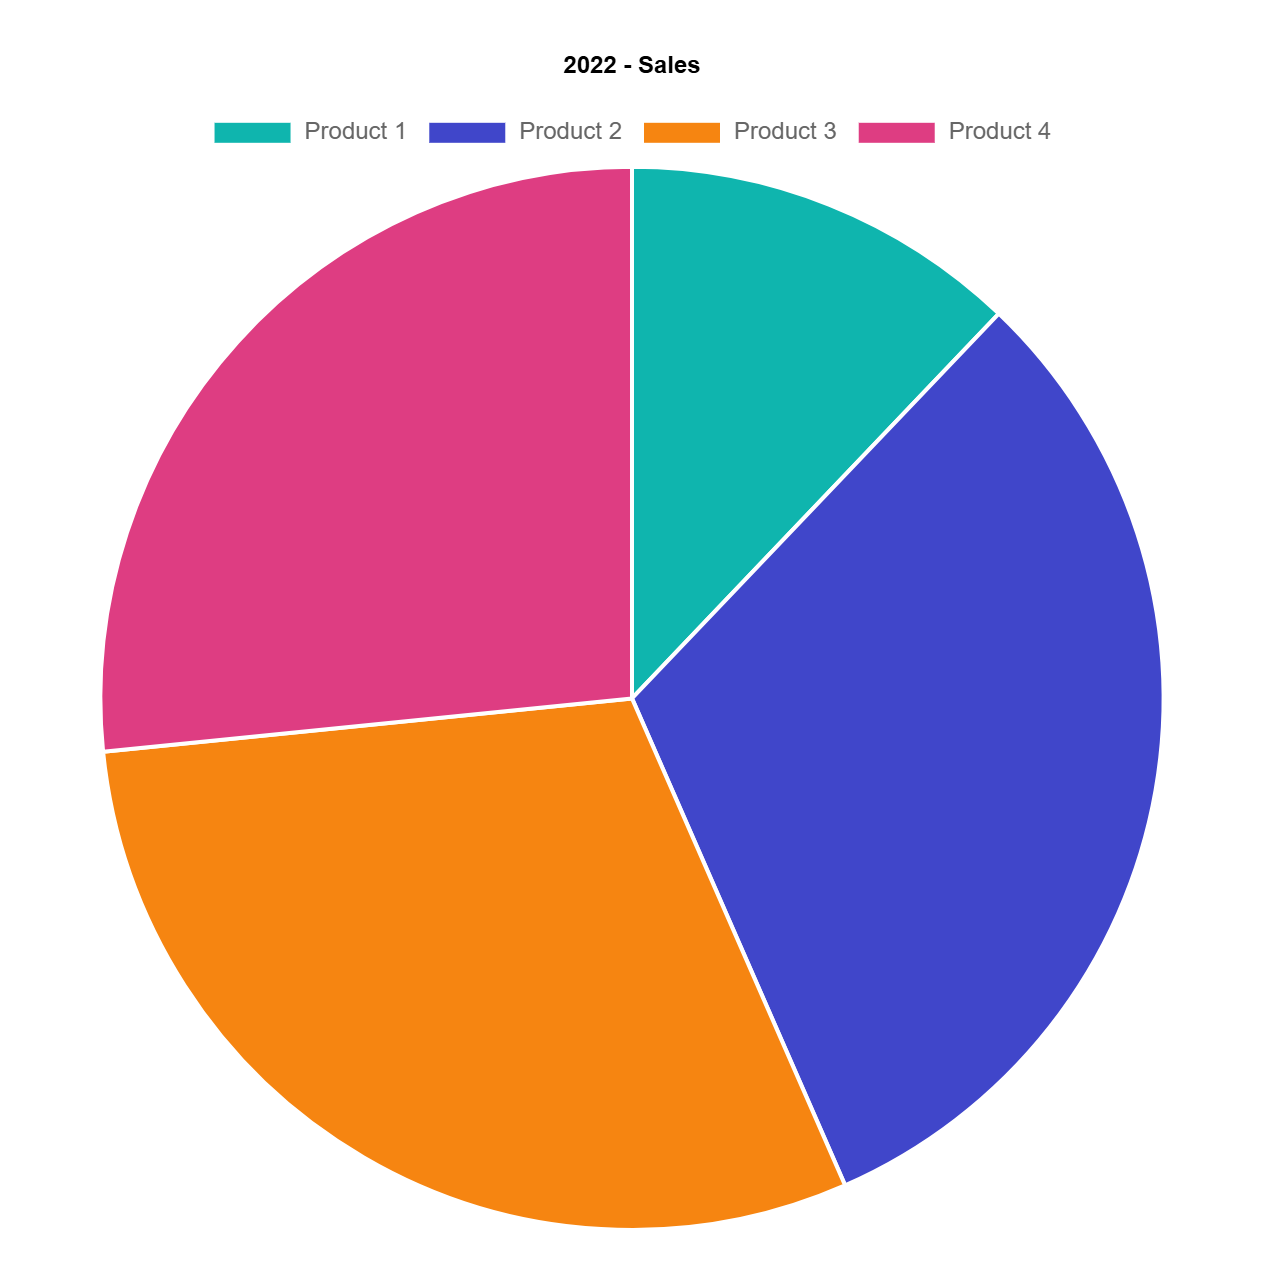
| Charts: Pie chart | Demos | Docs |
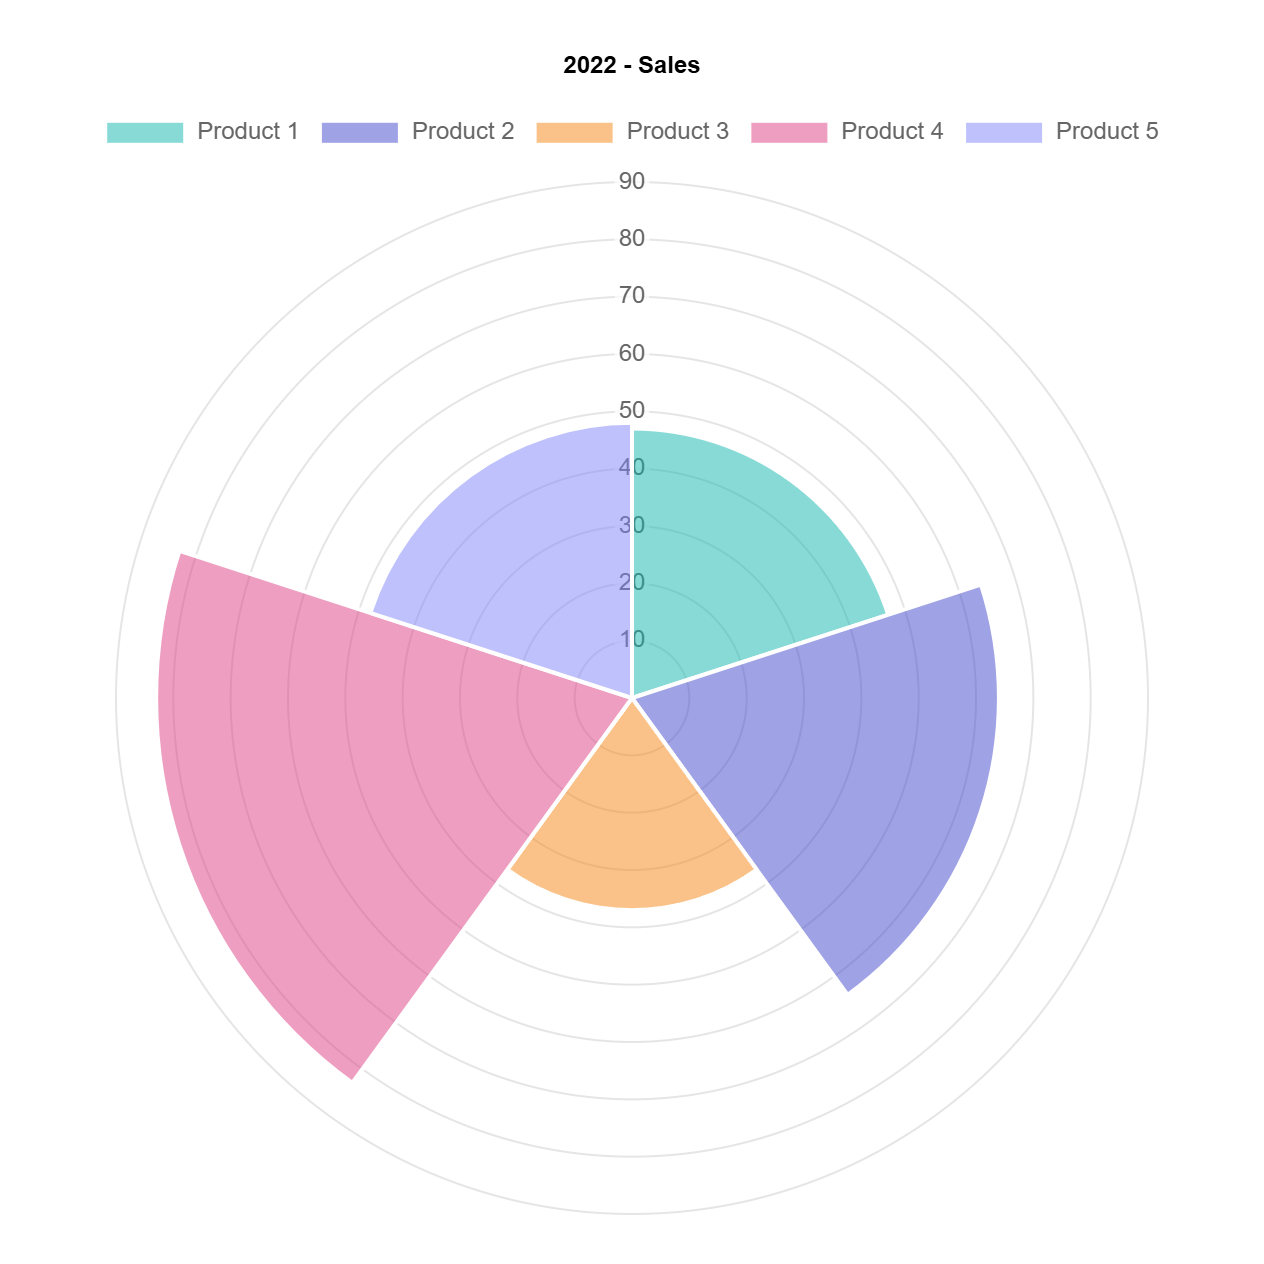
| Charts: PolarArea chart | Demos | Docs |
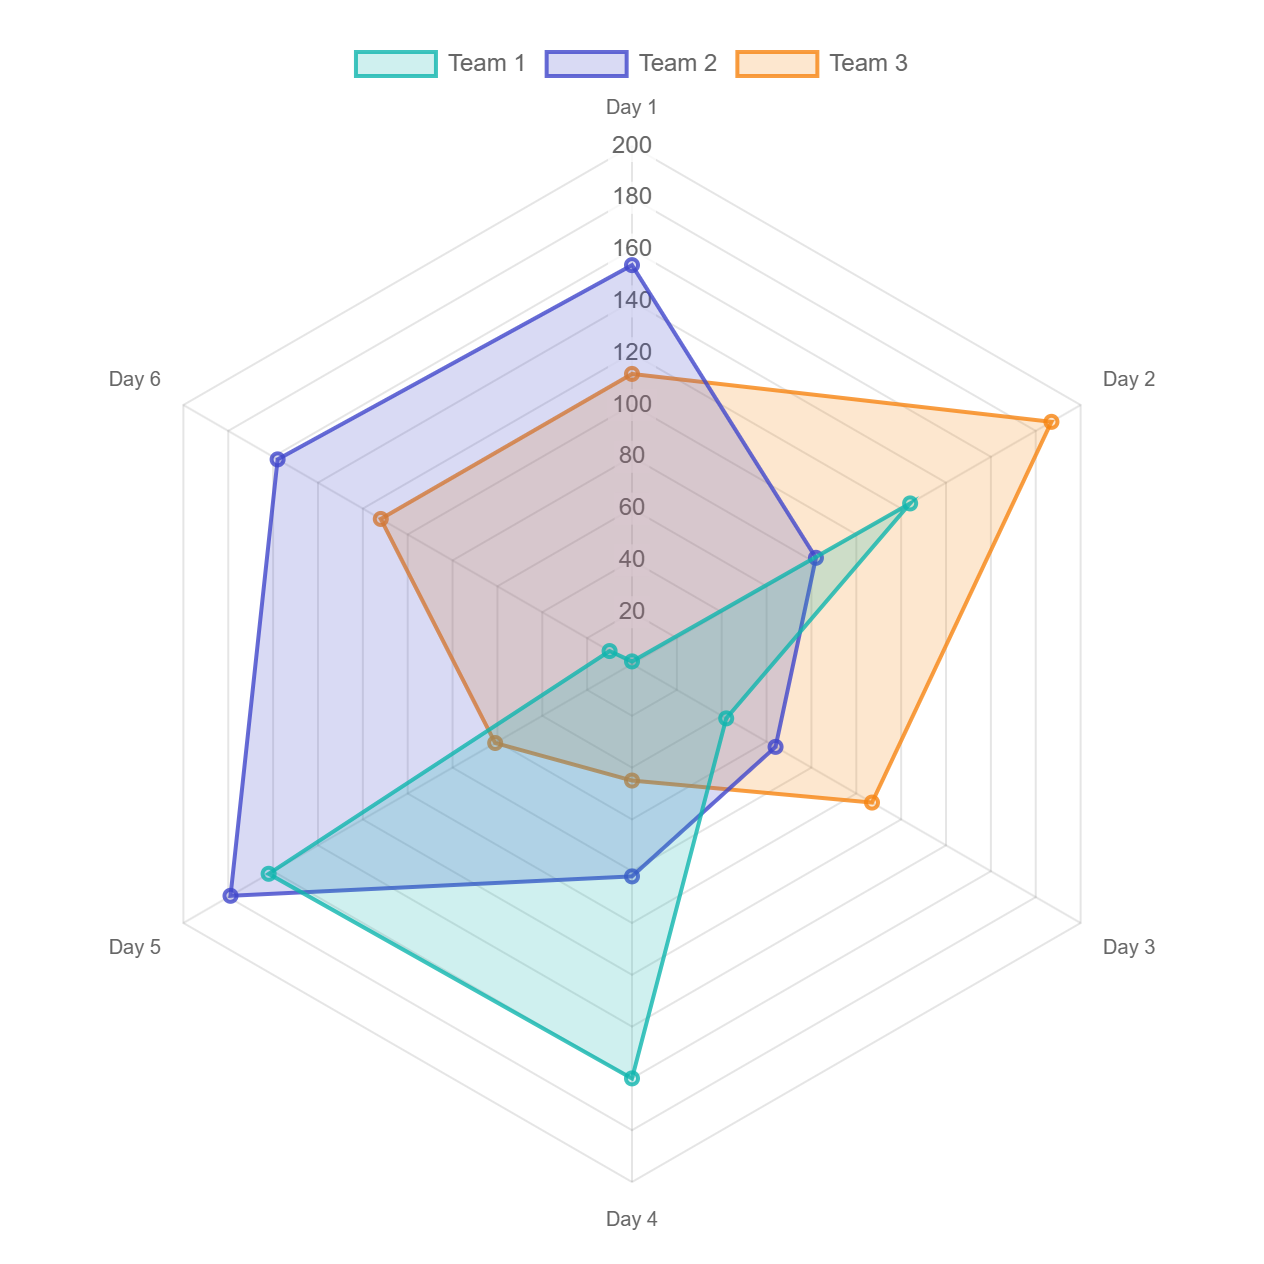
| Charts: Radar chart | Demos | Docs |
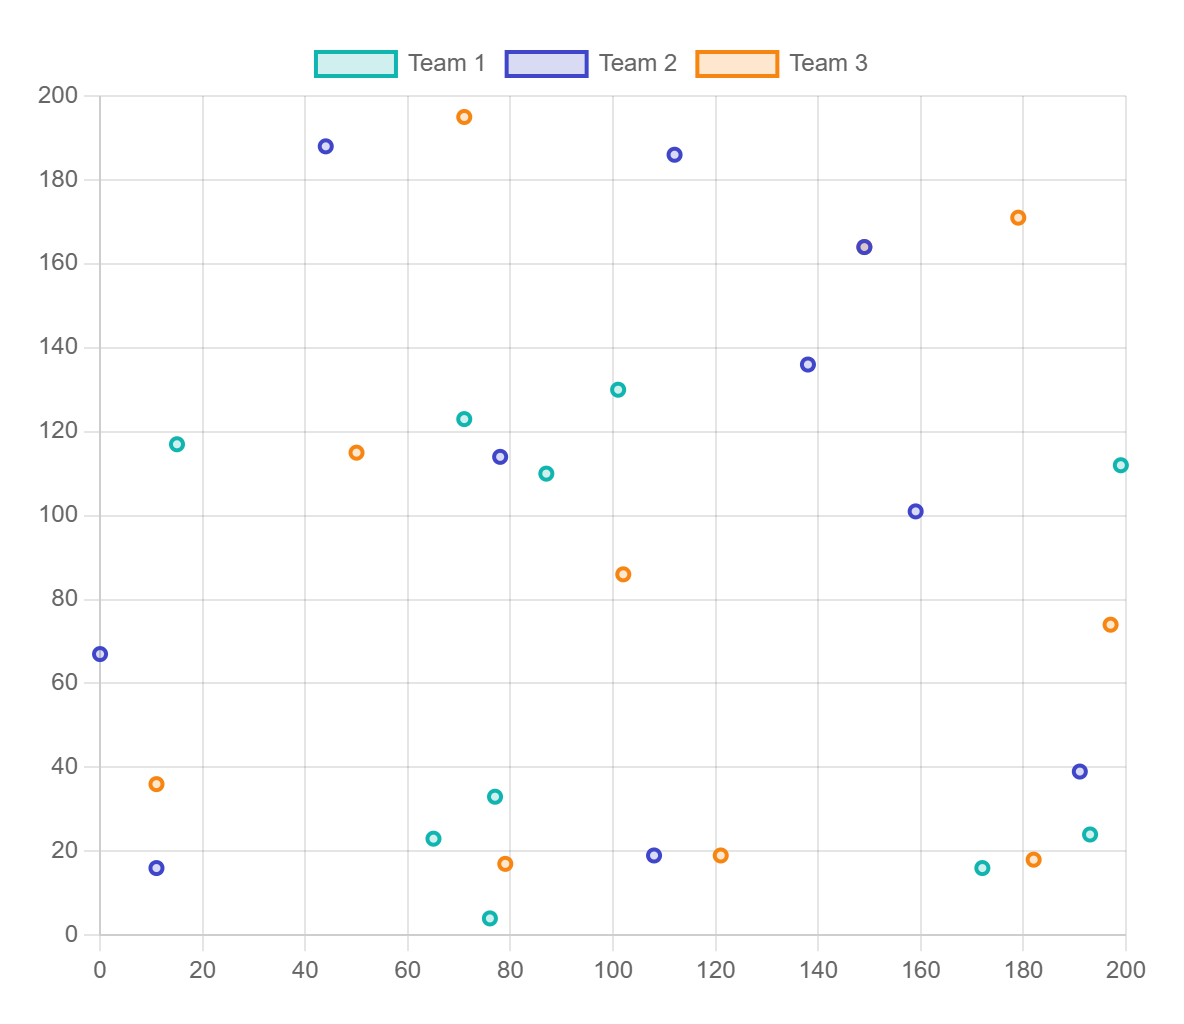
| Charts: Scatter chart | Demos | Docs |
Captured from the online demos.
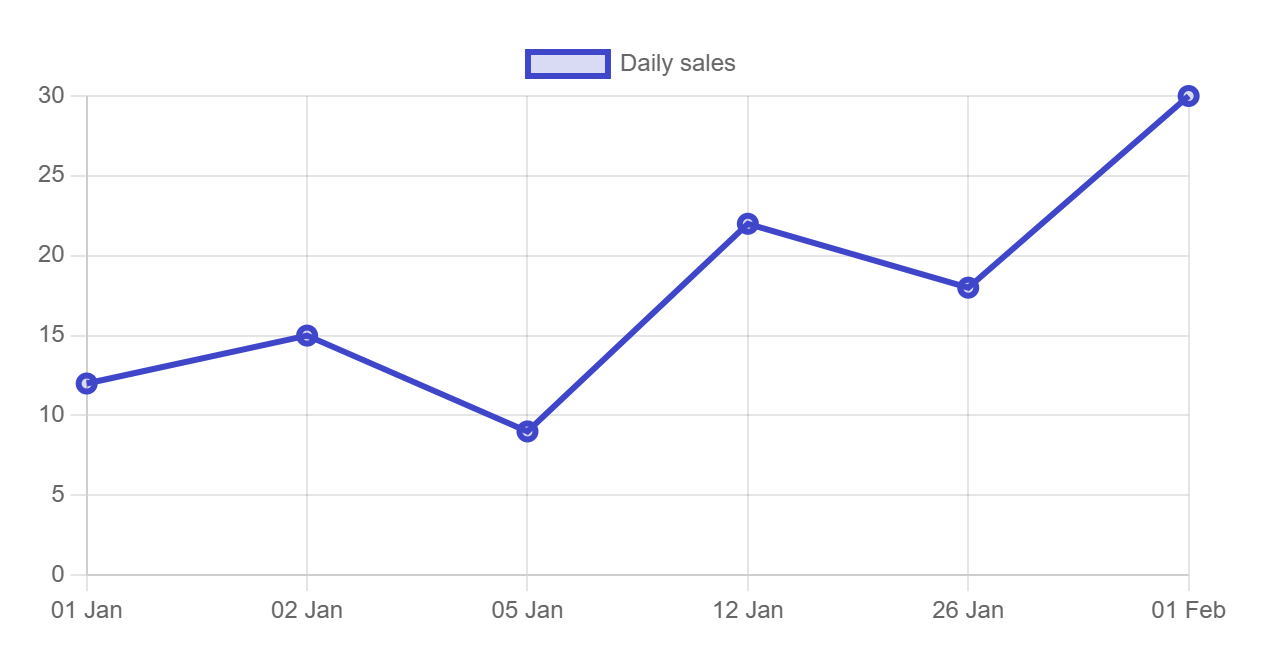
Line chart on a timeseries axis with dates from C#; no date adapter script needed.
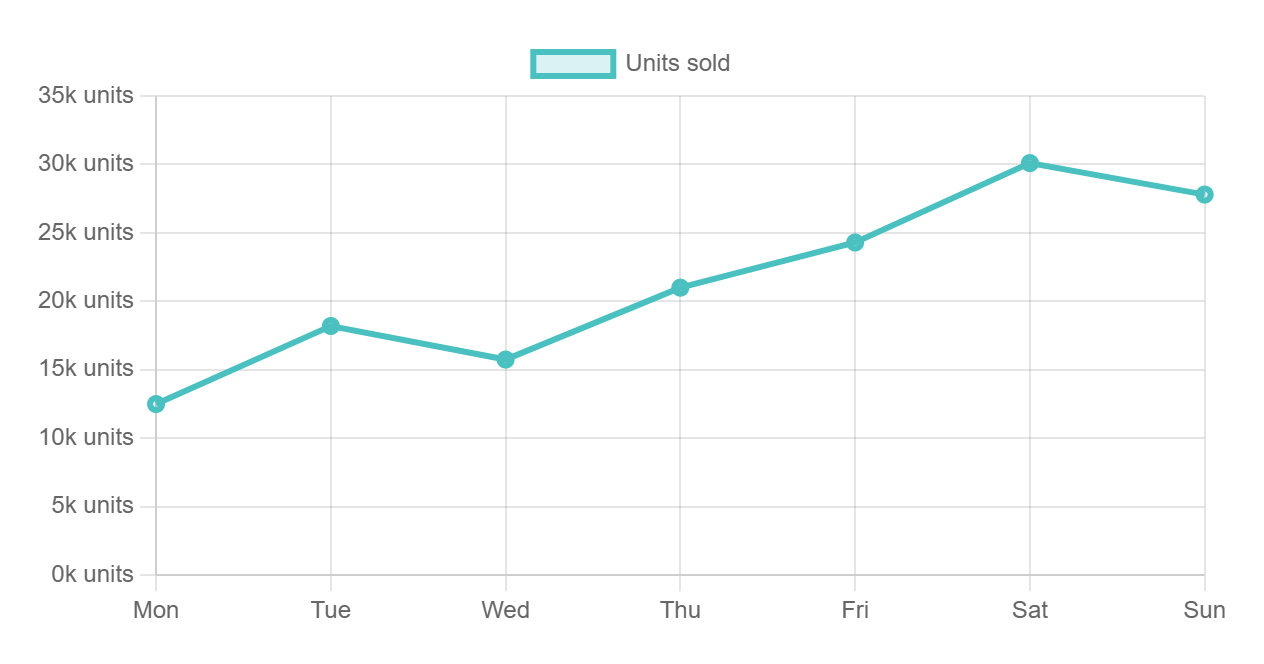
Axis ticks and tooltip text formatted by JavaScript functions registered by name and set from C#.
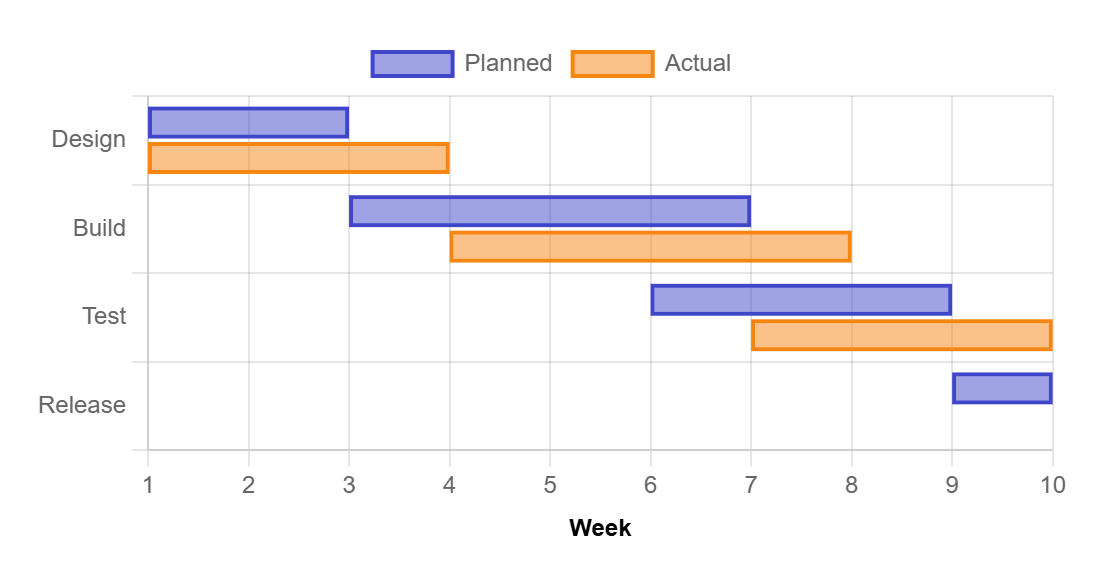
A project schedule drawn with floating bars, each with a start and an end value (BarChartDataset.FloatingData).
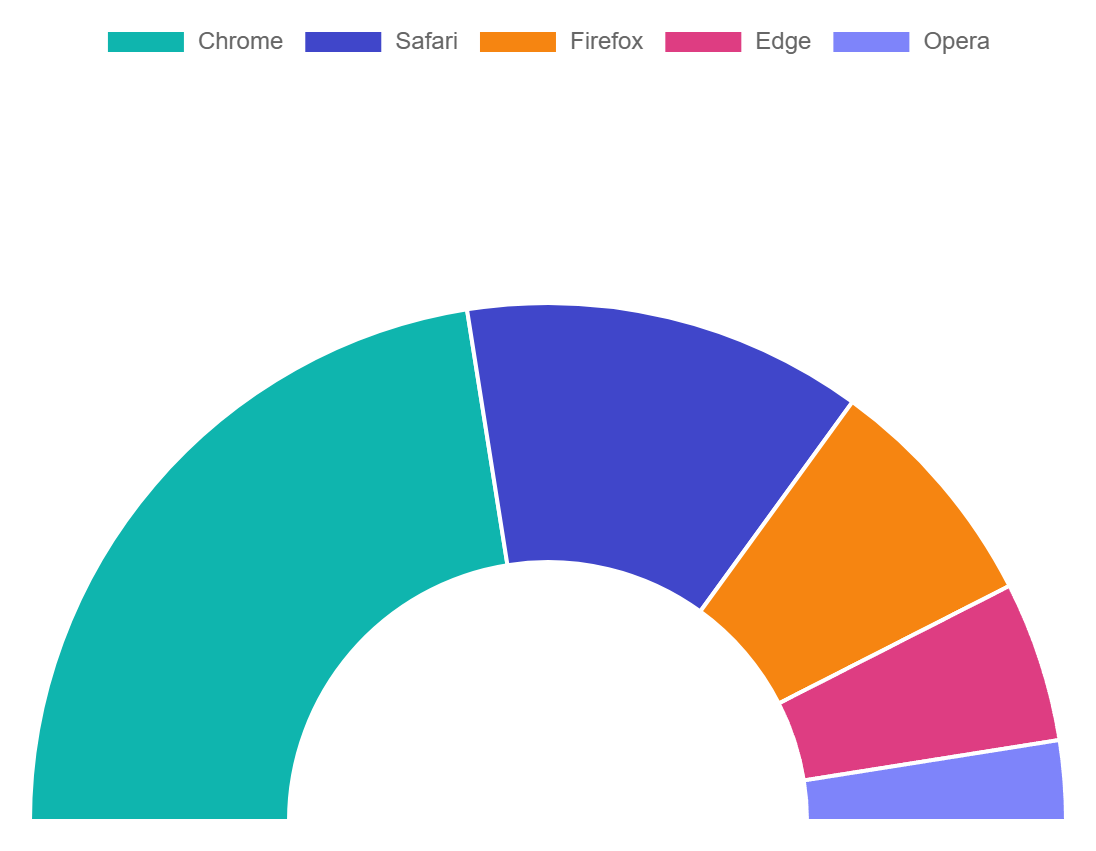
A half-doughnut gauge from Rotation and Circumference.
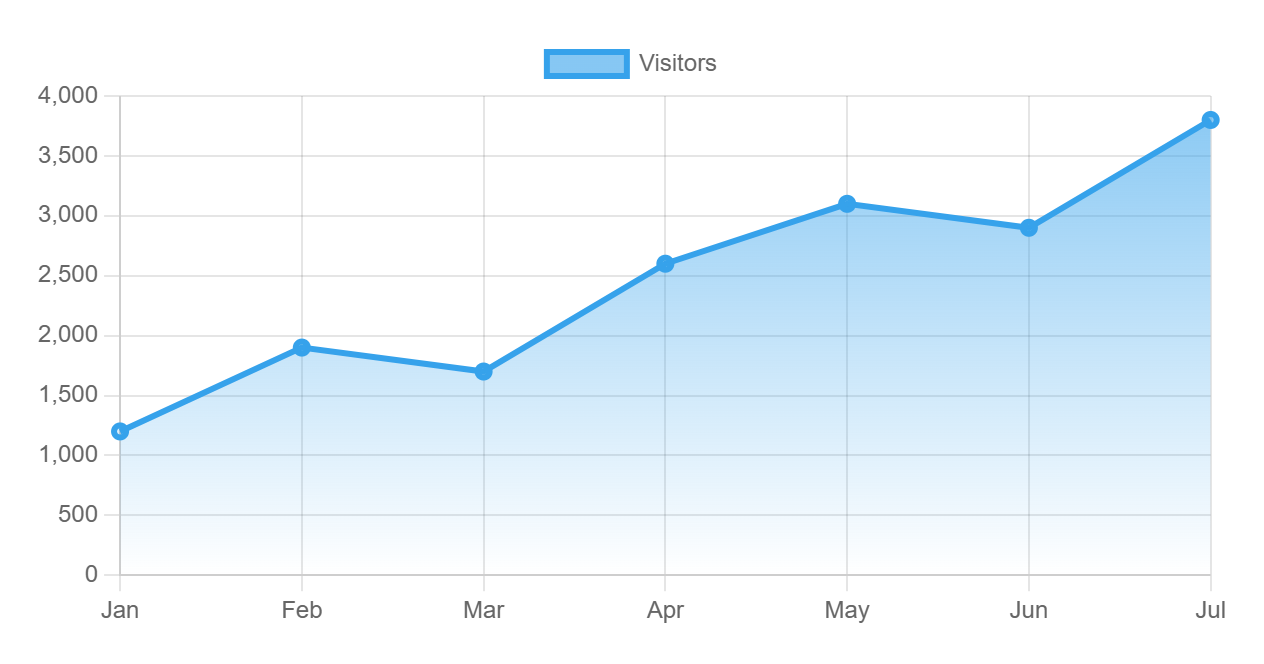
A line area filled with a gradient set by a JavaScript function.
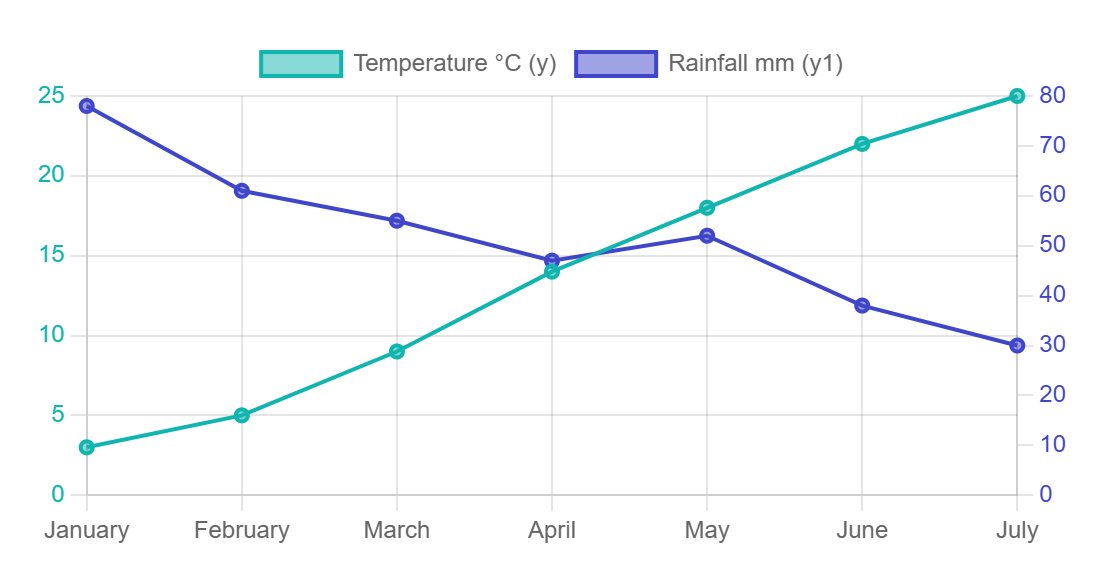
A second y axis on the right (Scales.AdditionalAxes).
More components coming...
Vikram Reddy
Code and documentation copyright 2026 Blazor Express Code released under the Apache-2.0 License.